
- Factors that Drive the Mobile App Development Cost
-
Tips to Reduce the Price for Developing an App
- Define Your App’s Core Functionality to Avoid Diversions
- Use Pre-built Templates and Modules
- Go for a No-code Development Strategy
- Consider a Cross-platform Approach
- Outsource to Budget-friendly Markets
- Leverage Open-source Tools and APIs
- Tone down the UI/UX Without Compromising Functionality
- Incorporate Cloud Services for Scalability
- Use ChatGPT to Build Your App
- Hacks to Secure Best ROIs on Mobile App Development Costs
- Some Case Studies to Look Out For
- What’s Next?

Did you know that Karhoo, a London-based taxi comparison app, raised a staggering $250 million– only to shut down after six months of launch? The culprit? Poorly strategized finance allocations that resulted in operational inefficiencies and subpar development quality. That is a prime example of one of the mistakes to avoid while planning your mobile app development costs.
The truth is that allocating the right amount of spending to each layer of development is as critical as planning the app’s objective. Without it, even the best ideas can crumble under the weight of poor execution, much like a house built on a shaky foundation.
But if planning finances for your app development journey feels like navigating through some minefield, our guide acts as your compass. We have prepared an in-depth roadmap that is packed with insights and just the correct amounts of milestones.
So, if you’re ready to get that budget put into the right place, let’s begin!
Factors that Drive the Mobile App Development Cost
The core planning of your mobile app development cost is driven by what you prioritize. Whether you’re going for a Minimum Viable Product (MVP) or a feature-packed powerhouse, keeping your cost-defining factors in check can save you from unpleasant surprises.
Let’s break down some real-world factors that influence the overall costs.
Locations of Developers
The first major factor that can impact the overall cost of app development is the salaries paid. Depending on where your preferred app development companies exist, salaries offered to folks working on your project can vary.
If you are going to outsource mobile app development projects to development companies, the cost will significantly vary based on the hourly salaries of developers in teams.
Based on the Glassdoor data, average salaries offered to developers across multiple regions fall in these ranges:
| Region | Hourly Salaries (Range) | Hourly Salaries (In USD) | Cost Paid to Companies |
|---|---|---|---|
| USA | $31.73/hr – $48.08/hr | $31.73/hr – $48.08/hr | $59.87/hr – $79.82/hr |
| UK | £12.98/hr – £22.12/hr | $16.35/hr – $27.87/hr | $40/hr – $45/hr |
| India | ₹1000/hr – ₹1200/hr | $12/hr – $14.40/hr | $36/hr – $43.20/hr |
| Australia | A$32.69/hr – A$48.08/hr | $21.25/hr – $31.25/hr | $39.38/hr – $52.50/hr |
Note: Cost paid to companies is calculated by adding the average hourly salary paid to local employees and perks provided on average in their respective locations. Depending on factors such as inflation, reputation, taxes, etc, these costs can vary.
Also Read: Breaking down the App Development Cost in the UK

Complexity of The Project
Complexity covers everything from the features you want in your app to the platforms you’re targeting for its launch. The kind of app you build also influences its complexity, impacting the overall app development cost.
For instance, to keep fitness apps competitive, integration of technologies like GPS, Wearable Support, AI-powered Personalization, and more are required.
The same goes for healthcare apps that demand healthcare sensors and enhanced cybersecurity protocols for extra security. Complexity also depends on the platform you’re targeting, whether iOS, Android, or both.
| App’s Complexity | Number of Hours | Overall Costs (USD) |
|---|---|---|
| Low | 400 | $23,948 – $31,928 |
| Medium | 800 | $47,896 – $63,856 |
| High | 1200 | $71,844 – $95,784 |
Note: Based on the earlier mentioned salary data, we filled in some gaps before calculating the final costs. We considered perks (15 % of the base app development cost) and profit margins (10 % of the base cost) that companies would include in final bills.
UI/UX Design
According to Upwork, freelance UI designers charge anywhere between $20–$40/hr. As for freelance UX designers, they charge anywhere between $25–$39/hr. Furthermore, upon diving deeper into our database of UI/UX design companies, we figured companies across the world were charging as low as $25/hr and as high as $300/hr. In India, app design companies were charging $25/hr on average, while in the USA, $99/hr was the commonly observed rate.
Beyond the locations of UI/UX designers, your mobile app interaction strategy can be an influencing factor. A typical strategy of such kind covers a number of features, a navigation roadmap, and a quantity of high-quality visual elements like animations and transitions. If you plan to go beyond standard UI templates, the app development cost can be dynamic depending on these factors.
Here’s a tentative overview based on the above data.
| UI/UX Complexity | Hours Required | Overall Costs | What’s Covered |
|---|---|---|---|
| Basic (Standard UI) | 50-100 | $1,250 – $4,000 | Basic layouts, standard templates, limited customization, simple navigation, minimal animations. |
| Moderate (Custom UI) | 100 – 200 | $4,000 – $19,800 | Custom branding, moderate navigation complexity, some animations, and visually appealing templates. |
| High (Advanced UI/UX) | 200 – 300 | $19,800 – $90,000 | Advanced custom designs, multi-layered navigation, high-quality animations, transitions, and gamification. |
Third-Party API Integrations
When you’re done with UI/UX designs, your next question should be: How much does API integration cost for mobile apps? Using APIs for apps requires you to consider a couple of things- it will enhance the quality of your app, but it also might enhance the overall cost of mobile app development. Some trending app APIs are Google Maps API, Firebase API, Open AI API, Zoom API, and more.
Google Maps API Cost for 80,000 Requests Per Month
| Product | Requests | Monthly Cost (USD) |
|---|---|---|
| Dynamic Maps | 80,000 | $560 |
| Dynamic Street View | 80,000 | $1,120 |
| Map Tiles | 80,000 | $48–$480 |
| Aerial View API | 80,000 | $1,280 |
| Static Maps API | 80,000 | $160 |
| Static Street View API | 80,000 | $560 |
OpenAI’s GPT API Costs
| Model | Token Type | Cost (USD per 1M tokens) | With Batch API (USD) |
|---|---|---|---|
| GPT-4o | Input Tokens | $3 | $1.25 |
| Output Tokens | $10 | $5.00 | |
| GPT-4o Mini | Input Tokens | $0.15 | $0.08 |
| Output Tokens | $1 | $0.30 | |
| GPT-4o Mini (Audio) | Input Tokens | $10 | $5.00 |
| Output Tokens | $20 | $10.00 | |
| o1 (General Reasoning) | Input Tokens | $15.00 | $7.50 |
| Output Tokens | $80.00 | $40.00 | |
| o1 Mini | Input Tokens | $3.00 | $1.50 |
| Output Tokens | $12.00 | $6.00 |
Stripe API Costs
| Feature | Pricing | Notes |
|---|---|---|
| Standard Plan | 2.9% + $0.30 per successful charge (domestic cards) | Pay-as-you-go, no hidden fees. |
| Instant Bank Payments | 2.6% + $0.30 per transaction | Supports faster bank payments. |
| ACH Direct Debit | 0.8% per transaction (capped at $5) | Used for recurring charges or large payments. |
| International Payments | Starting at $0.80 for iDEAL | Supports global payment methods. |
| 3D Secure Authentication | $0.03 per secure authentication attempt | For added security. |
| Buy Now, Pay Later (Klarna) | Starting at 5.99% + $0.30 per transaction | Flexible installment options. |
| Card Account Updater | $0.25 per account update | Automatically update expired or renewed card details. |
| Adaptive Pricing | Conversion fees start at 2% | Supports local currencies globally. |
| Post-Payment Invoices | 0.4% per transaction total (capped at $2 per invoice) | Simplifies invoicing processes. |
| Sigma (Business Analytics) | Starting at $10/month + $0.02 per charge | Includes pre-built queries and custom reporting. |
| Radar (Fraud Management) | $0.05 per screened transaction | Advanced fraud detection tools. |
| Identity Verification | $1.50 per ID document verification | Includes biometric ID verification and database checks. |
| Instant Bank Account Verifications | $1.50 per successful verification | Free for micro-deposit verifications. |
| Billing (Recurring Revenue) | Starting at $620/month (or 0.7% of billing volume for pay-as-you-go) | Supports recurring billing models. |
| Revenue Recognition | 0.25% of transaction volume | Simplifies revenue tracking and compliance. |
| Data Pipeline | $0.03 per transaction | Sends data to your warehouse for analytics. |
| Disputes | $15 per dispute | Charged for handling chargebacks on card transactions. |
| Tax Automation | 0.5% per transaction (pay-as-you-go) or $90/month (yearly contract) | For global tax calculation and filing support. |
Maintenance Costs
Well, once your app joins the real world, it will face one of the biggest challenges: device compatibility issues. You will need to create an app maintenance budget to tackle this challenge. Maintenance can be a part of app development costs to make apps safer, upgrade the user experience, make them more compatible with modern devices, etc.
Tentatively, the overall cost of maintaining an app can be somewhere between 15 to 20% of the overall cost. However, during the first year of its launch, the cost can be as much as 50% of the total development cost.
The first year of the launch remains the most experimental and expensive for multiple reasons. This period helps identify possible compatibility issues, observe core performance, measure ROIs, etc.
Suppose the initial application development cost is $100,000. Given at 15-20% of the total, the maintenance cost can fall between $15,000 to $20,000 per annum to ensure the app remains competitive and smooth. Here’s a slight breakdown of what’s included in the cost of maintaining an app.
| Maintenance Category | Percentage Cost | Total Cost |
|---|---|---|
| Bug Fixes | 15–25% of maintenance cost | $2,812.50–$4,000 |
| OS Updates and Upgrades | 25–35% of maintenance cost | $4,687.50–$5,600 |
| Server and Hosting Costs | 20–30% of maintenance cost | $3,750–$4,800 |
| Security and Compliance | 10–15% of maintenance cost | $1,875–$2,400 |
| Performance Monitoring and Analytics | 5–10% of maintenance cost | $937.50–$1,600 |
| Third-party API Maintenance | 5–10% of maintenance cost | $937.50–$1,600 |
| Total | 15–20% of $100,000 | $15,000–$20,000 |
Also Read: Breaking down the app maintenance costs
Targeted Platforms
The cost of mobile app development is significantly impacted by the choice of targeted platforms. Costs of building apps can vary depending on the kind of devices the app is focused on, development technologies required, deployment strategies, etc. It’s better to dive a little deeper to understand how platforms impact the cost.
Native Apps
Mobile applications that are built to target specific platforms are called native apps. Depending on the target platform, the cost can vary. Android app development costs, compared to iOS development costs, can be very diverse due to the extensive range of targeted platforms' device specifications.
- Android
Android apps use technologies like Java, Kotlin, Python (through app development frameworks), C++, etc. The tentative cost can be very diverse and fall anywhere between $20,000 to $150,000 based on the project's complexity and where it’s developed.
Also Read: Discover what it really costs to build an Android app in-depth!
- iOS
For iOS apps, making an app can cost anywhere from $10,000 to $100,000. This cost includes using technologies such as Swift, Objective-C, Xcode, and more. iOS apps are considered cheaper to build compared to Android apps because of a limited number of devices.
Cross-platform Apps
Apps that are designed to target multiple platforms are called cross-platform apps. While there are tons of cross-platform development frameworks present to speed up development and reduce overall costs, overall investment can still be dynamic.
These dynamic investments are based on the number of targeted platforms, features required in apps, etc. The cost can fall anywhere between $25,000 to $60,000 for a project that is 300 to 800 hours long, at a cost of $30 to $200 per hour.
Hybrid Apps
These apps use HTML/CSS/JS-based webview to offer their features. These are simpler apps that are designed to run on the internet. The major difference between hybrid apps and native apps is their ability to deliver quality.
As hybrid apps are supposed to be lighter, they offer a lesser number of features and quality standards. A simple hybrid can cost as little as $10,000, and an app designed to offer a greater amount of complex features can cost as much as $150,000.
Ongoing Mobile App Costs
Mobile app development pricing can be dynamic based on ongoing and critical expenses. These costs often depend on resources that power the app’s existence and performance.
Collectively, app development costs also change as user expectations change with time. App upgrades and evolving functionalities also cause some ongoing costs. Now, to understand better, let’s break these costs down briefly.
Hosting
Hosting costs can vary based on whether you use shared or dedicated resource allocations. Several names in the industry offer these services. Hosting services impact the overall cost to develop an app based on storage space required, data transfer speed, ownership, etc.
Here’s an overview of some popular hosting services.
1. AWS
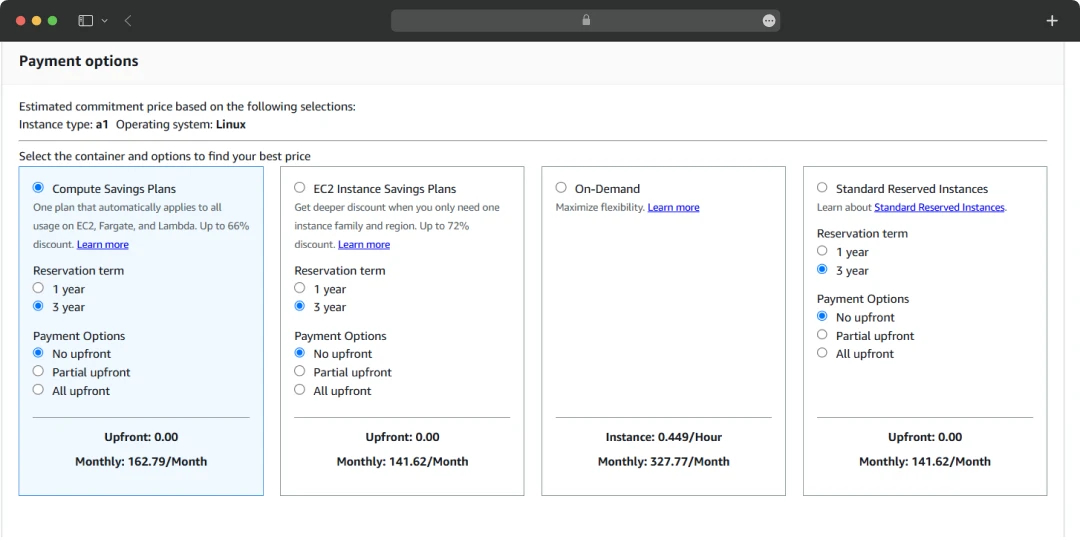
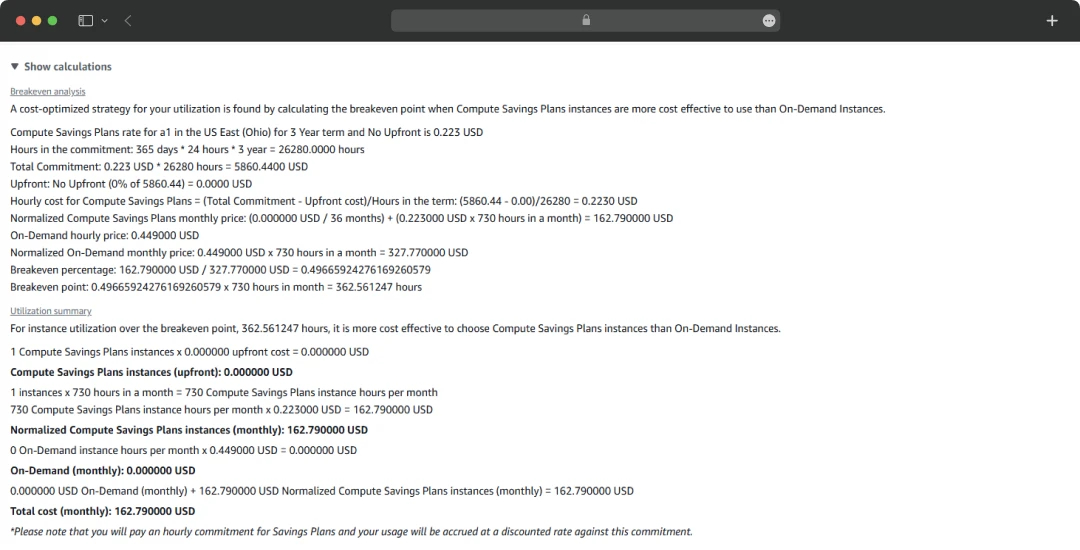
Our first example is AWS, which gives you an overview of how much does it costs to create an app’s hosting space. To get a tentative estimate, we used the official AWS calculator. To get the estimate, these are some steps we followed that can help you get an exact quotation for your hosting requirements.
We picked ‘Local Zone’ as the location type and used ‘US East (Boston)’ to make the location more specific.
Under ‘Tenancy,’ we selected ‘Dedicated Hosts’ and defined the number of these hosts as ‘1’.
As a result, we had a data breakdown of Instance Family, vCPUs, and Physical Cores on our screen.
With the given filters, these were the estimations we received that heavily impact app development costs.
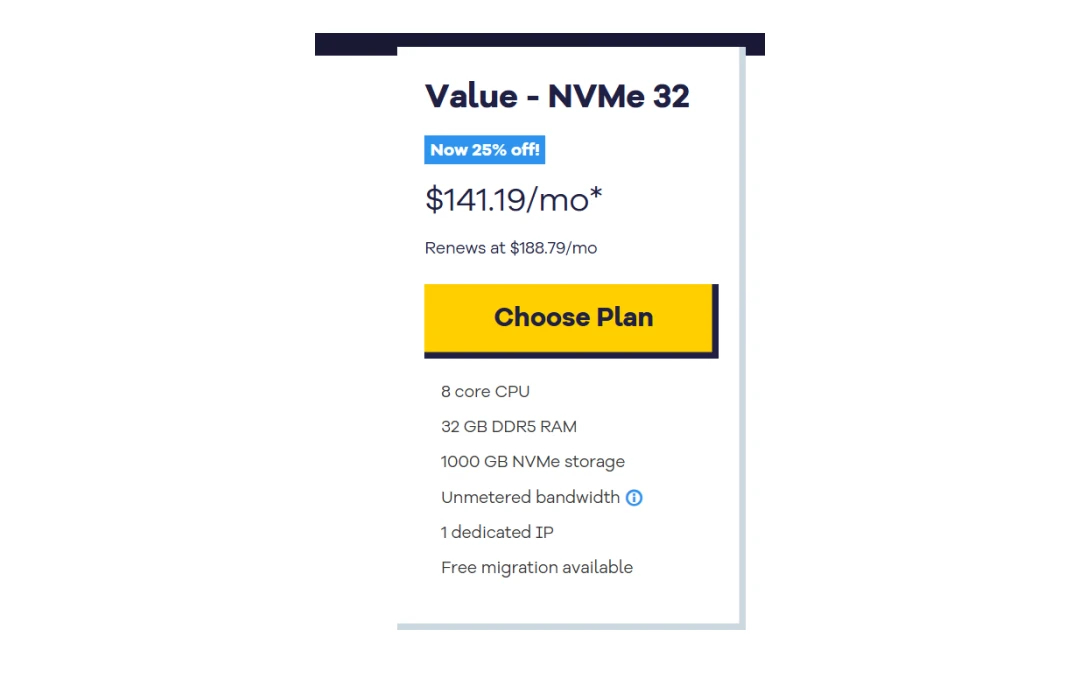
2. HostGator
Another great solution in the market for hosting your app is HostGator. The tool offers dedicated hosting space as well as shared ones to host apps. Comparatively, its rates are also lower, especially compared to those of its counterparts like GoDaddy.
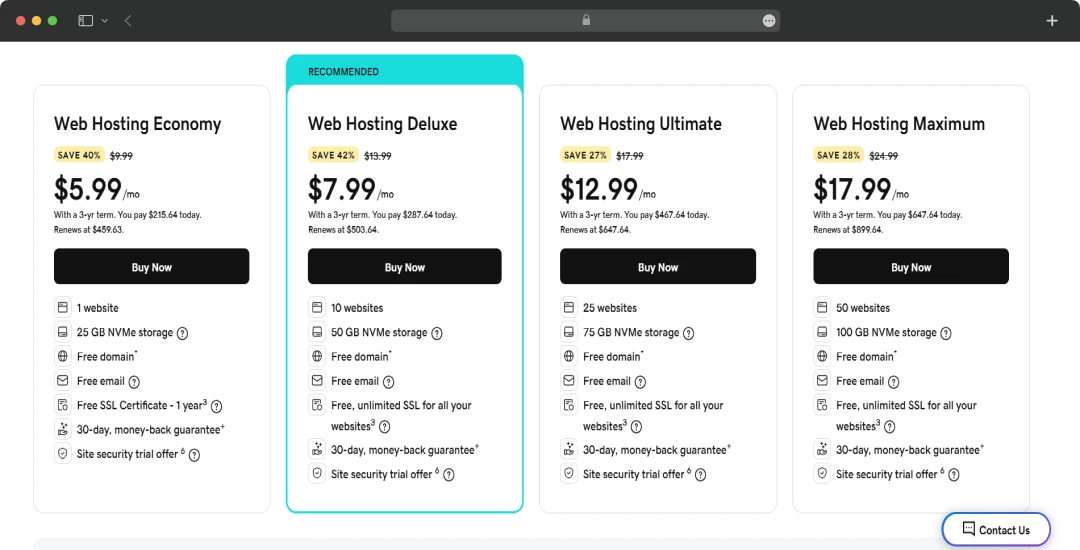
3. GoDaddy
For scalable solutions, GoDaddy is probably the best hosting solution in the market. The platform offers packages targeting startups and small businesses to enterprises functioning in multiple countries. According to the official website, GoDaddy's high-performance resources cost between $5.99 and $17.99 per month. The platform also offers customizable solutions for larger requirements.
Security and Compliance
As critical as it is to improve your mobile app security, it significantly enhances your app’s ongoing cost. SSL certificates are now issued to make modern applications comply with the latest mobile security trends.
These are paid certificates issued by plenty of popular brands out there. The cost of these certificates can vary based on what they cover, the reputation of the issuer, and the length of the certificate’s validity. Here are some brands we used as an example to gather tentative cost data:
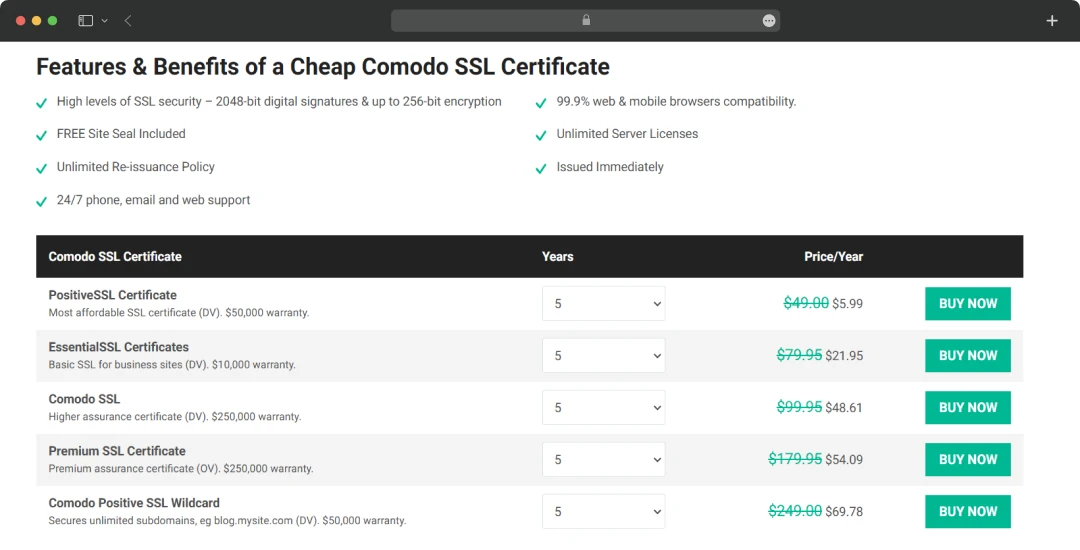
1. Comodo SSL Store
Comodo offers 2048-bit signatures and up to 256-bit encryption through its SSL certificates. As for its impact on the app development cost, that remains dynamic as the brand keeps launching new offers every now and then.
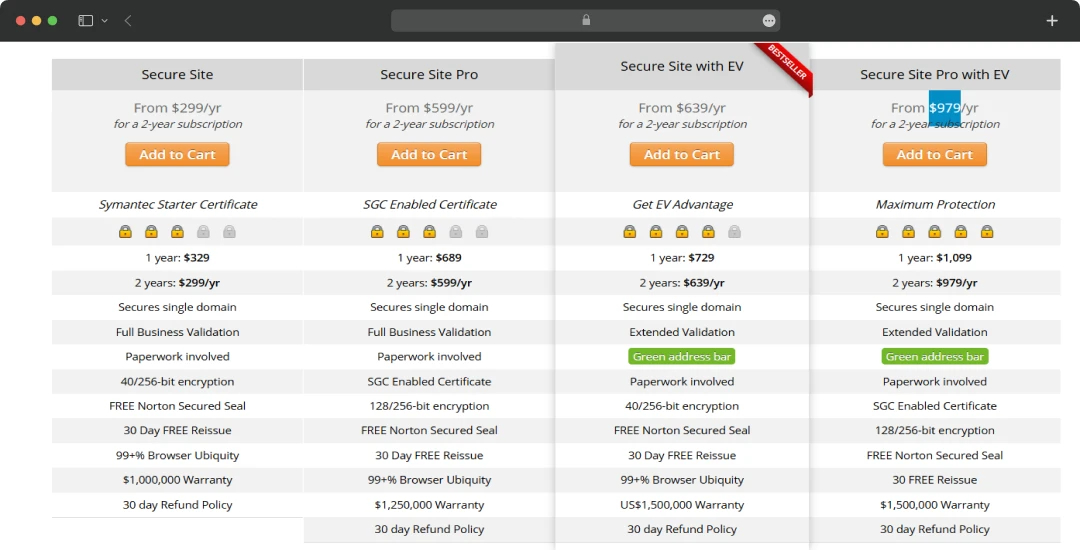
2. Symantec SSL Certificates
One of the popular cybersecurity tools, Norton, in collaboration with Symantec, provides SSL certificates. These are divided into four categories based on their functionalities. The cost can fall anywhere between $299 per year and $979 per year for two-year subscriptions. Here’s an overview of the price that is charged by Symantec SSL experts.
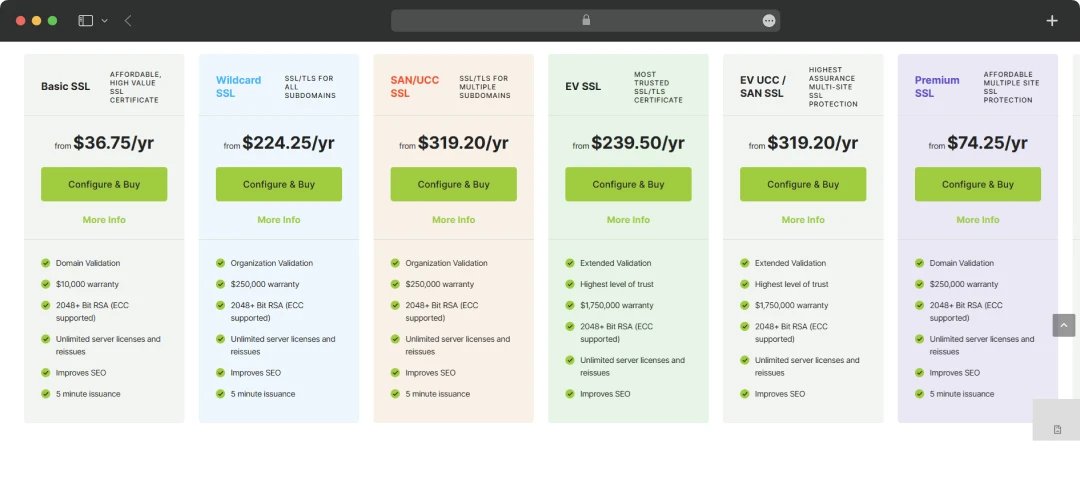
3. SSL.com
Founded in 2002, SSL.com is one of the largest SSL service providers. The platform offers plans varying from $36.75 to $319.20 annually. Some dynamic features under different packages include the number of supported domains and subdomains. Here’s some data from official sources for detailed SSL.com certificate costs.
Push Notifications
To gather constant app engagement, you need tactics that inform users as soon as you publish something new. Push notifications are the key. However, the cost of most push notifications is based on subscriptions, which makes them a recurring expense.
Some push notifications offer limited support for free, but for a large user base, push notifications can demand some budget. Here are some of the popular push notification tools and their respective prices to consider when calculating app development costs.
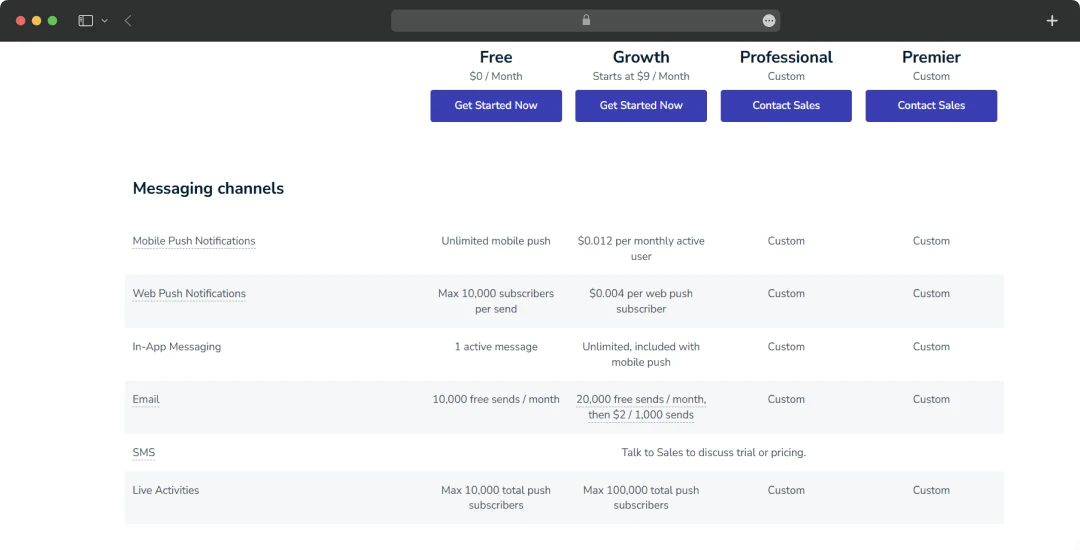
1. OneSignal
OneSignal is one of the most popular push notification services in the market, with a diverse range of notification services to offer. Best part? You can subscribe to its packages based on customized requirements.
Now, before you include OneSignal in your app creation cost strategy, there’s a free plan as well that covers unlimited mobile push notifications, 10,000 web push notifications, 10,000 free emails, and more. Beyond that, here are some subscription categories to sign up for its services.
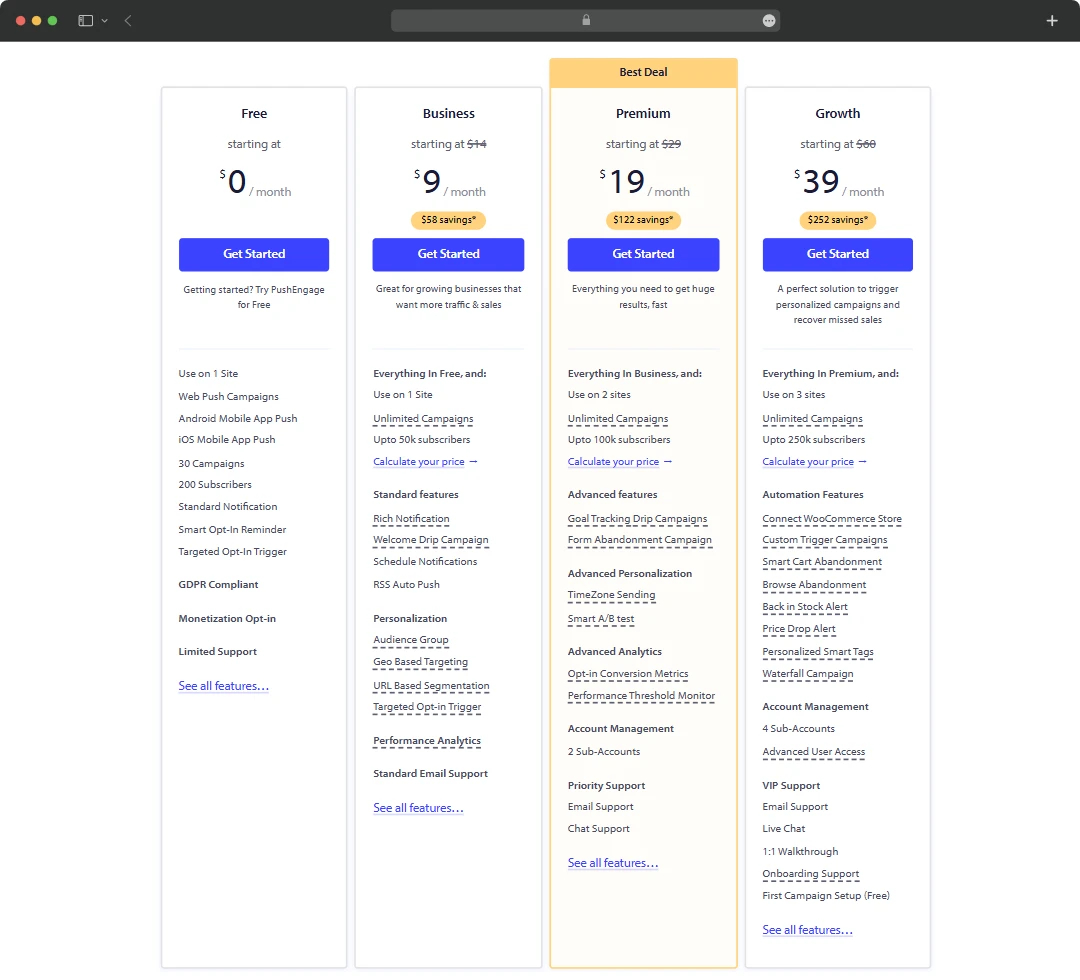
2. PushEngage
You get plenty of customization options to target specific use cases with PushEngage. The tool claims to have served digital products of multiple niches, including ecommerce, gaming, news, fintech, etc. As for its plans, you have four options to choose from.
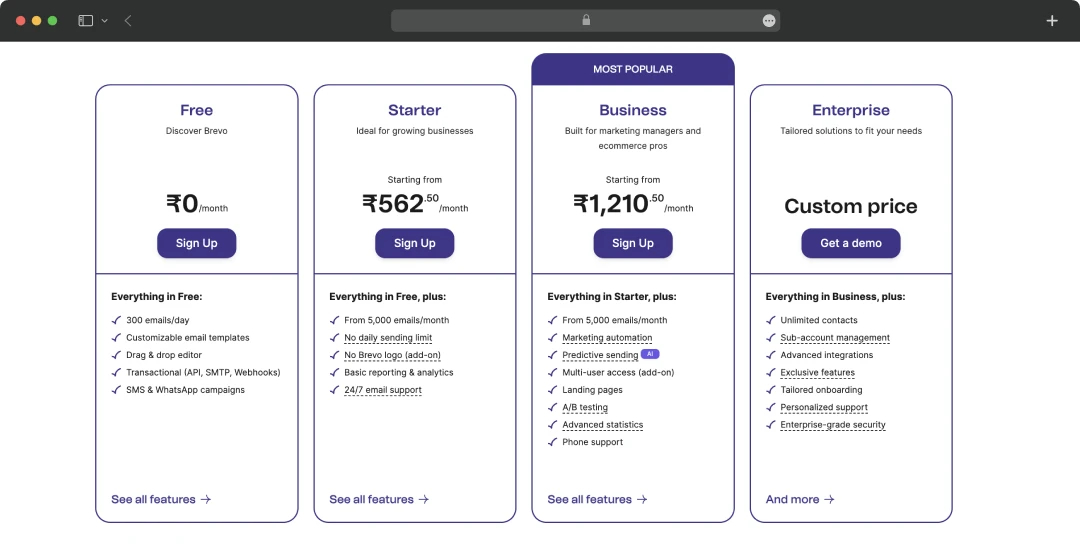
3. Brevo
With over 500K users spread across 180 countries, Brevo is a phenomenon popular among modern app developers. There are automated marketing campaigns offered by the tool that can help you boost website traffic, multiply your revenue, and enhance the overall efficiency of campaigns.
Here’s how much it costs:
Performance Monitoring and Analytics
App analytics tools are a core part of the app’s growth strategy. So, you might need to subscribe to some tool that offers features of app analytics. Let’s look at a few examples and see how they will impact your mobile application development cost.
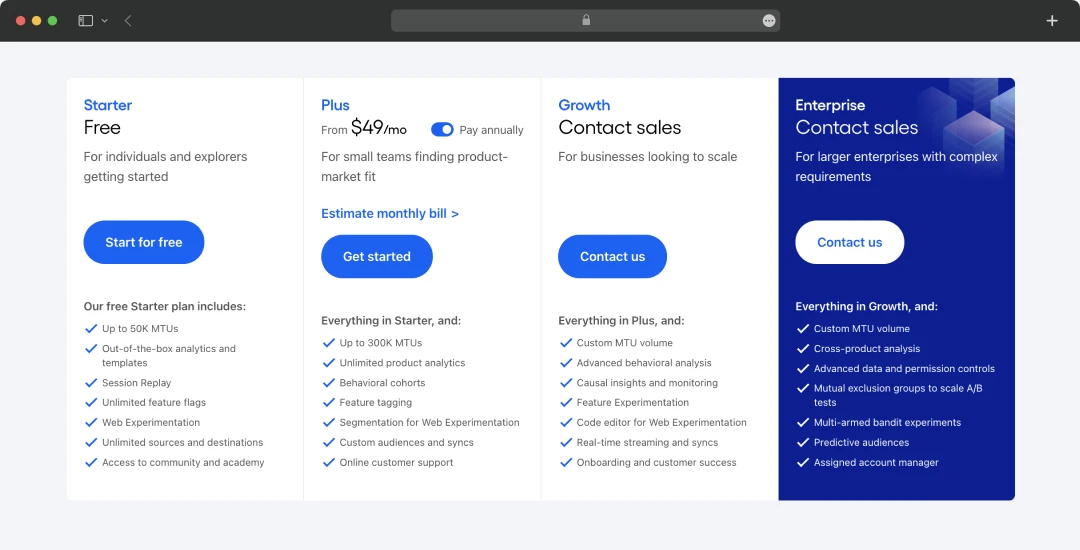
1. Amplitude
Plans are divided into four major categories starting with the free plan offering 50K MTUs, Session Replay, Web Experimentation, and other such features. The tool also offers monthly and annual subscriptions.
For larger or customized requirements that fit better to your planned mobile app development cost, you can connect to the sales team and get trimmed plans to target your app specifically.
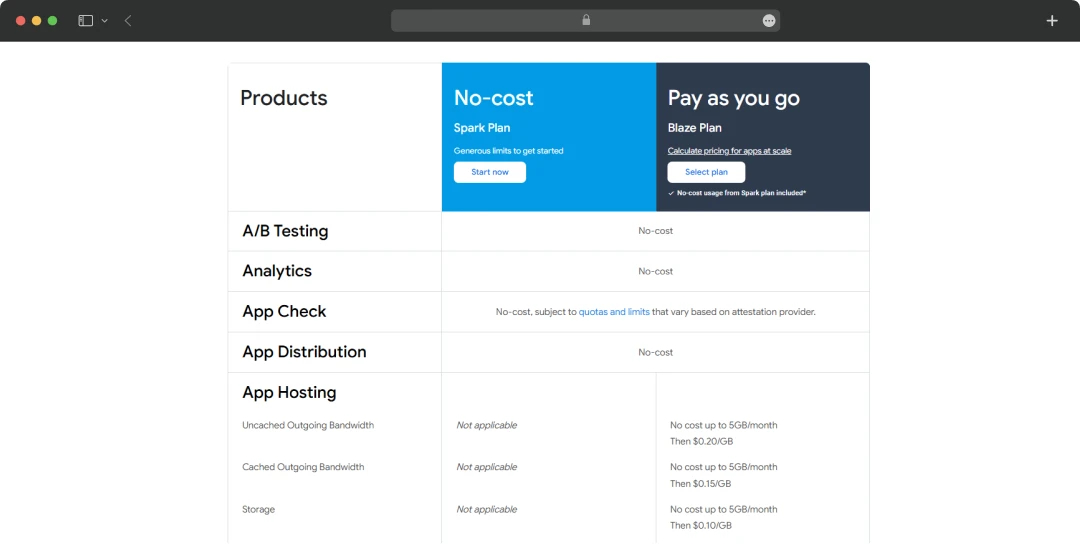
2. Firebase Analytics
Firebase’s AI-powered app analytics can help you drive great ROIs, without leaving an impact on your average app development cost as well. Firebase offers its analytical services for free, just like its popular alternative- Google Analytics. However, add-on services like App Hosting, Cloud Firestore, etc., can be charged to you.
3. Google Analytics
You might have heard of this if you have kept up with evolving data analytics tools. Google Analytics is free for almost every tracking-related task. However, it offers Analytics360 as well.
A solution that is designed to offer customized solutions. In this product, you can sign up for customized real-time reporting solutions, monetization reports, etc. As for the cost, Google’s sales team can help you out with that.
Additional Resources
Beyond hosting, notification, security, and analytics, the apps' resources keep changing, depending on what you are planning to achieve through them. Here’s an example of these additional mobile app development costs, along with popular tools.
- Content Delivery Network (CDN): Amazon CloudFront CDN’s Data transfer out costs are free for the first 1TB globally, with subsequent charges varying regionally from $0.085/GB (US, Canada, Europe) to $0.120/GB (Southeast Asia).
- Customer Service: Zendesk, one of the popular customer solutions, costs between $55 and $115 per month per agent. The brand also offers customized services that are suitable for enterprises with customized costs.
- Legal and Compliance Costs: To make your apps compliance-friendly and legally authorized, certain additional steps will be required. These can cost some more money. For instance, regular audits, app optimizations, etc.
- Development Tools: Some tools required to manage productivity and collaborate better can attract extra charges, impacting the total mobile app development cost breakdown. For example, Github’s services are free, but the tool costs $4 per user per month for advanced features. There’s an Enterprise plan that charges $21 per user per month.
Compliance Costs and Taxes
For apps, depending on their niche and target markets, compliance costs become crucial. For instance, in New York, a state sales tax of 4% is imposed. However, local jurisdictions also get the right to impose taxes which can be specific to cities and counties.
Beyond taxes, some compliance costs that can impact overall budgets are:
- GDPR: For European countries, GDPR is a significant parameter that allows apps to function. The parameter requires ISO 27001 and ISO 27701 Certifications that can cost differently depending on the size of your business.
- HIPAA: As it is applicable to healthcare apps, HIPAA costs can be very dynamic. HIPAA is an ongoing process that can fall anywhere between a few thousand dollars to $100,000+ for almost a year-long project. This cost can be calculated by taking audit requirements into account once the project blueprint is ready.
- Intellectual Property Protection: Trademarks are divided into two classes: TEAS Plus costs $250, and TEAS Standard costs $350.
- Contracts and Licensing Agreements: Getting an app or software development agreement drafted can attract some costs. Service providers charge between $800 to $2,000.
Calculating the Overall App Development Cost
Calculating the cost of building a basic app with simple UI/UX designs, basic API integration, and nominal costs. Based on the above data, here’s a tentative breakdown:
- Base Development Cost: $12,692
- UI/UX Design Cost: $1,000
- API Integration Cost (Google Maps, annual): $1,920
- Hosting Cost (GoDaddy Economy Plan, annual): $71.88
- SSL Certificate Cost (Basic SSL): $36.75
- Push Notification Cost (OneSignal Free Plan): $0
- Analytics Cost (Firebase Free Plan): $0
- Maintenance Cost (15% of Base Development Cost): $1,903.80
Total Cost: $17,624.43
Adding additional expenses to this cost
- Total Cost: $17,624.43
- GDPR Compliance: $5,000 (Tentative)
- HIPAA Compliance: $7,500 (Tentative)
- Trademark Cost (TEAS Plus): $250
- Agreements: $1,400
Subtotal: $32,124.43 (Before Taxes)
+Add Taxes (7%): $32,124.43 × 7% = $2,248.71
After-Tax: $34,373.14
+Add Commission (10%): $34,373.14 × 10% = $3,437.31
After Commission: $37,810.45
+Add Platform Fees: Fixed Fee: $500
Final Cost: $38,310.45
Note: The app development cost can vary depending on taxes applicable in states from where services are provided.
Post-development Costs
Once the app is developed, there will be additional costs associated with its publishing to app stores and promotion. Here’s a tentative breakdown:
- The fee to submit an app to the Google Play Store is $25
- The fee to submit an app to the App Store is $99
- The costs of marketing an app can be ongoing depending on your app's promotional strategy.
Tips to Reduce the Price for Developing an App
By prioritizing your expenses, you can plan your mobile app development cost to allocate your funds properly at each layer of development.
Define Your App’s Core Functionality to Avoid Diversions
Your app’s functionality should be very focused on avoiding cluttering. It not only improves the user experience but also lets you declutter and properly allocate your mobile app development cost. These “must-haves” should be based on what you are planning to achieve by launching your app.
Whether it’s personalized learning, collecting survey data, or offering a great game or streaming experience, your plan should have clear milestones beforehand.
Use Pre-built Templates and Modules
Pre-built templates and module libraries can significantly help reduce the overall time needed to build an app. However, beyond the development time, these templates can also be significantly helpful in reducing the overall development budget.
By using pre-built templates, you can focus on integrating and customizing existing app features instead of building an app from scratch. This approach reduces the consumption of overall resources and lets you invest money in other important tasks.
Go for a No-code Development Strategy
Nick Nagatkin, CEO of Digis, highlighted the importance of automated tasks and MVP creation in his interview with MobileAppDaily. During our conversation, he emphasized the importance of using modern tools to automate everything possible.
Luckily, many low-code development platforms with features that reduce manual coding requirements massively or entirely are available in the market.
For modern developers, low-code platforms come as a rescue, decluttering their mobile app development costs. Such advantages are why the low-code development market is valued at $32 billion in 2024 compared to $22.5 billion in 2022.
Consider a Cross-platform Approach
Cross-platform development is known for saving money, but it might demand that you give up on some functionalities. Compared to native apps, cross-platform app development is done to target multiple platforms, which is where the complication comes in.
As Karol Wegner, CEO of itCraft, in an interview with MobileAppDaily states:
“Most advanced mobile applications are not done with cross-platform because it requires some kind of compromise. It is an excellent choice for entirely new, innovative startups and Minimum Viable Products (MVP). But for final, high-quality solutions, we recommend native technologies.”
Outsource to Budget-friendly Markets
Application outsourcing is a booming market, with its worth projected to reach $120.10 billion in 2026 globally. Reason? Abundance of perks that come with outsourcing. You can relax your mind, be free of responsibilities, and, in parallel, ensure quality remains unbothered.
As Aditya Garg, Head of Solutions Consulting at Genesys, suggests, India is turning into the world's outsourcing capital. That remains true for several reasons, including competitive service costs. The same applies to more locations, such as the Philippines and China, where more and more application projects are being outsourced due to comparatively lower mobile app development costs.
However, outsourcing comes with hidden costs. For instance:
- If you are outsourcing your app development to India, 18% Goods and Service Tax (GST), Tentatively 10% Withholding Tax (WHT), and dynamic corporate taxes will be applicable.
- For the UK, taxes like VAT at a 20% standard rate will be added to the final cost along with corporation and Withholding tax.
- For the Japanese market, typical taxes like VAT can be added at 10% with Withholding taxes and Corporate taxes, which are dynamic.
Leverage Open-source Tools and APIs
Open-source tools and APIs are the keys to a budget-conscious development approach. For instance, using Google Maps or Firebase APIs helps you add more features to your app while paying either minimal or nothing for their features. This can be a great approach to keep the cost of app development under control in the long run.
Tone down the UI/UX Without Compromising Functionality
For reducing the cost to develop an app, simplicity is the secret sauce you need. By focusing on clean, intuitive designs, you can improve user satisfaction and significantly reduce design costs by reducing development time—often by up to 55%.
And here's the kicker: Simpler designs often resonate better with users. Overloading your app with flashy, intricate details might look impressive, but it can also confuse users and drive them away.
Instead, focus on functional elegance, keeping it visually appealing while ensuring every element serves a purpose. This approach ensures a streamlined app development process and better ROI.
Incorporate Cloud Services for Scalability
Cloud solutions are a developer’s best friend, handing them over smooth scalability and cost management. Most cloud models come with a pay-as-you-use model for your mobile app development cost. This helps developers avoid unnecessary expenses.
The best part? Having these cloud services an option eliminates or significantly reduces the requirement of investing in your own data center. So you save money on hardware, power requirements, infrastructure, and more. Yet your app remains smooth.
Use ChatGPT to Build Your App
The best way to save the cost of developing a mobile app is to take advantage of modern tools. GPT, for example, offers you the ability to build apps from the ground up without having to manually code anything at all. Even though there might be some limitations to building an app using GPT, it can be great if you want to test the waters.

Hacks to Secure Best ROIs on Mobile App Development Costs
With a few hacks in place before launching your app development plan, you can strategize the security of your app ROIs. To understand more, here’s an overview!
Include In-depth Market Research in Your Cost to Build an App
The best way to boost your app’s ROI is to know what you’re launching it for, and that can be done by organizing in-depth market research. You need to gather stats that are relevant to the industry you are targeting. Otherwise, you’re playing with the guessing game, and that can be risky for ROIs significantly.
The reason why it’s important is to keep the retention rate stable. Why? Let’s take an example. According to Appsflyer, action gaming apps for Android and iOS witness 21.95% and 28.22% of day 1 retention rates.
By the 30th day, these rates fall to 1.23% and 3.41% respectively. Researching your app can help your app maintain a stable retention rate by giving you a clear roadmap of features and the navigation strategy required.
Focus on User Experience
Atul Ranjan, CTO of GeekyAnts, recommends a trial-centric approach. He recommends that to improve the user experience, it is better to launch the app with an ideal UI first and then go from there. Well, user experience is a dynamic process.
As devices evolve and users evolve with them, mobile UI design trends evolve as well. Keeping up with these trends can be great for ROI, justifying the overall app development cost you invest and making you extra money.
Optimize Performance for Faster Loading Times
Loading times for apps is as crucial as oxygen for living beings. A ThinkwithGoogle report says as soon as the app load time increases from 1 second to 3 seconds, the bounce rate will be boosted by 32%. So, how do you reduce the app loading time? Well, by including an effective app maintenance budget while planning your cost to create apps.
The budget will focus on compressing images, keeping the code clean, countering cyberattacks, detecting possible glitches, etc.
Regular Updates to Retain and Engage Users
96% of apps on Google Play are updated at least once every year. This keeps users engaged. However, engagement is not the only factor that makes developers want to add this expense to the high cost of developing a mobile app.
Frequent development offers additional perks, such as advantages in App Store Optimization (ASO), glitch-free functionality, and dynamic user experience. In short, frequent updates boost visibility and keep the app interesting.
Picking the Best Pricing Models
Choosing the right pricing model to plan your cost to build an app can impact your app’s ROIs. Some popular pricing models in the industry are:
Monetize Effectively with Freemium Models
Use Freemium models to bring users on board, then monetize them. Tons of gaming apps, like PUBG, Freefire, etc, have done the same. Language learning apps like Duolingo have also adopted this approach. It makes it easier for them to taste the experience. However, to upgrade it, users have the choice to pay. A win-win situation for both parties.
Go for a Fixed-pricing Model
This model demands a one-time app development cost. However, it lacks flexibility for changes during development. A fixed-pricing model is best if your app doesn’t offer dynamic functionality and you do not have the resources to keep updating new features.
Milestone-based Pricing Model
Your payment plan can be divided into milestones. At each milestone, the project is reviewed and paid for. If any changes are required, both parties find a middle ground to meet these changes before proceeding to the next milestone. This way, any issues can be addressed quickly without wasting extra effort, time, or money.
Revenue-Sharing Model
This model suits startups or partnerships where the initial investment needs to be minimized. Instead of paying upfront, you share a percentage of app revenues with the development team.
App Developer Magazine reports that this approach can be a win-win, offering access to high-quality development while reducing financial risks for early-stage businesses.
Some Case Studies to Look Out For
While most brands do not publish their mobile application development costs publicly, we can still take a tentative based on the functionality and quality they offer. Here’s an estimation of a few popular brands.
Building an App like Uber
To build an app like Uber, you need to plan features that are not only user-centric but also focused on service providers. Uber’s development covers registration, card details, locations, fare calculator, KYC, and other such features that could demand 300 to 400 iOS app development hours and 300 to 400 Android app development hours influencing the app development cost accordingly.
Combined with additional requirements such as Backend development (150 to 200 hours) and Admin Panel (350+), the total time is estimated to cross 1300+ hours in the development process.
Now, let’s multiply the same with region-wise costs based on the above-discussed data to get an answer to the question: how much does it cost to make an app like Uber?
| Country | Total Cost Range |
|---|---|
| India | $33,360 - $60,048 |
| USA | $83,219.30 - $110,949.80 |
| UK | $46,106.30 - $61,465.80 |
| Australia | $54,738.20 - $72,975.00 |
Building an App Like Dropbox
An app like Dropbox requires not only a dedicated storage space but also an easy interface that supports multiple devices. Beyond that, Dropbox also requires great cybersecurity standards.
Combined together, several technologies like Python, MySQL, Rust, Framer, and Nagios are used to build an app like Dropbox. As for the cost, it can fall between $15,000 to $200,000 in the USA based on hours varying between 150 hours to over 1000 hours.
| Complexity | Total Cost Range | Hourly Costs |
|---|---|---|
| MVP | 1–2 Months | $100/hr to $150/hr |
| Moderate | 3–6 Months | $100/hr to $150/hr |
| High | 6–12 Months | $100/hr to $150/hr |
Also Read: In-depth Dropbox-like-app development cost
Building an App Like the Cash App
The cost of mobile application development that is inspired by the Cash App can be a little demanding. It requires consideration of features like peer-to-peer payments, secured financial databases, internet security, automatic settlements using smart contracts, verifications, and more.
The Cash App also offers support for trading stocks and cryptos, push notifications, bank accounts, etc. Combined together, the major factor that influences custom app development cost for an app like Cash leans towards the cybersecurity factor.
Tentatively, this cost can fall anywhere between $100,000 to $150,000.
Also Read: Explore a detailed Cash app cost breakdown
Building an App Like Doctor On Demand
The cost of building a telemedicine app like Doctor On Demand requires in-depth market research to comply with several regulatory agencies. As for the features, the app needs to cater to the requirements of service providers and service seekers.
Some of these features can be support registration, profile management, doctor profiles, video conferencing, etc. Collectively, the number of hours to build a HIPAA-compliant app like Doctor On Demand can cost as much as $300,000.
Building an App Like ChatGPT
Since GPT went viral, the question that went viral was: How much does it cost to build an app like GPT? Well, GPT demanded a massive amount of money, which included $4.6 million just for the data training. Apart from that, several millions went into launching the chatbot on multiple platforms, including smartphones, websites, etc.
Research done by Time shows that 34% of the amount spent on GPT was to compensate for the research part. The second highest was contributed to supporting hardware apart from AI chips.

What’s Next?
With the insights you’ve gained, you’re ready to plan your app development costs strategically. From choosing the right pricing model—be it fixed, milestone-based, or freemium—to leveraging cost-effective solutions like open-source tools and cross-platform development, every decision can significantly impact your ROI.
Keep in mind that ongoing costs like maintenance, security updates, and compliance can add up to 15–20% of your development budget annually. By prioritizing features, simplifying UI/UX, and exploring budget-friendly markets, you’re already one step ahead.
Now it’s time to put these strategies into action and make your app the next big success story!
Frequently Asked Questions
-
How much does it cost to develop an app?
-
Does the choice of platform affect the app development cost?
-
What are some factors that influence the overall mobile application development cost?
-
Which is the best pricing model for startups?
-
What are the advantages of using a freemium model for app monetization?
-
Why is ongoing compliance necessary for apps, and what does it cost?
-
How can I reduce the cost of mobile app development?
-
How do third-party API integrations impact development costs?
-
How much does it cost to make an app in India?
-
Can I build an app without any cost?


