To acquire more customers and keep them engaged with your application, the most understandable route would be to use app analytics and its metrics to get data-driven insights for making changes.
The app market currently is full of app ideas imaginable to the human head and catering to the different needs of its users. In fact, sometimes it feels that there won’t be any idea that will be disruptive unless a revolutionary technology takes the reign (such as ChatGPT). This is the reason, the number of applications that make the A-list are few.
This, however, by no means says that the remaining apps are unworthy of users’ attention. In fact, there is a huge difference between the apps that are good and are generating revenue versus the ones that are good but are on the verge of complete failure. Yes, we are talking about marketing and it makes all the difference.
A good marketing campaign is data-driven and understands the needs of its users by using app analytics. In fact, understanding concepts like growth marketing vs performance marketing can help businesses choose the right strategy for improving user acquisition, retention, and long-term engagement. In fact, there are plenty of initial startups and huge companies that spend a lot of capital but fail to see the opportunity in data-driven insights. Insights that can be gathered using historical as well as current data. Insights that can help you understand what your user requires and would respond to. Insights that will increase the stickiness of the application and make it an incredible competitor in its niche.
Therefore, to peel app analytics layer by layer and explore some important mobile app metrics associated with it, let’s read ahead…
Introduction to App Analytics
App analytics is the process of collecting, measuring, analyzing, and interpreting different data generated by a mobile application. App analytics gives us a way to understand user behavior and their interaction with the application.
Need of App Analytics
As per Business of Apps, the total number of apps on the Apple App Store is close to 1.76 million. On the other hand, the Google Play Store has a total of 2.26 million apps.
To further add, the app market is a huge opportunity considering it is expected to grow up to $935 billion in the year 2023.
With so much competition but enough room to fit in, the only thing that determines the true difference in app adoption is customer-centric marketing strategies.
If entrepreneurs today are not focusing on mobile app metrics, they are losing on loads of opportunities such as:
- Collection of user data (downloads, user demographics, user sessions, in-app actions)
- Capability to establish KPIs to check the success of the campaign
- Identification of different trends and patterns
- Visualization of data with different charts, graphs, and dashboard
- Checking the number of installs in a specific period of time
- Capability to understand the response of different segments of users of the app
- Capability to understand the different areas of opportunity. For instance, a particular product or service liked by the customers
- Capability to know the pages that have the maximum conversion
- Capability to see the competitive advantage of the application
- Get actionable insights to improve the application
Aside from these, app analytics is essential for creating customer-focused products. Today, the market is saturated with tons of applications that cater to a single problem. Therefore, it becomes essential for you to understand the areas of improvement clearly.
There are heatmap tools like VWO, Microsoft Clarity, and many others that offer the capability to check the interactions of each user within the app for each app page. The possible areas where conversion was possible and places which weren’t adequate. Adding to it, app analytics metrics generated give an overall comprehensive view of the application and how the customers are responding to each and every update done with the app.
Key Metrics Used for App Analytics to Determine App Success
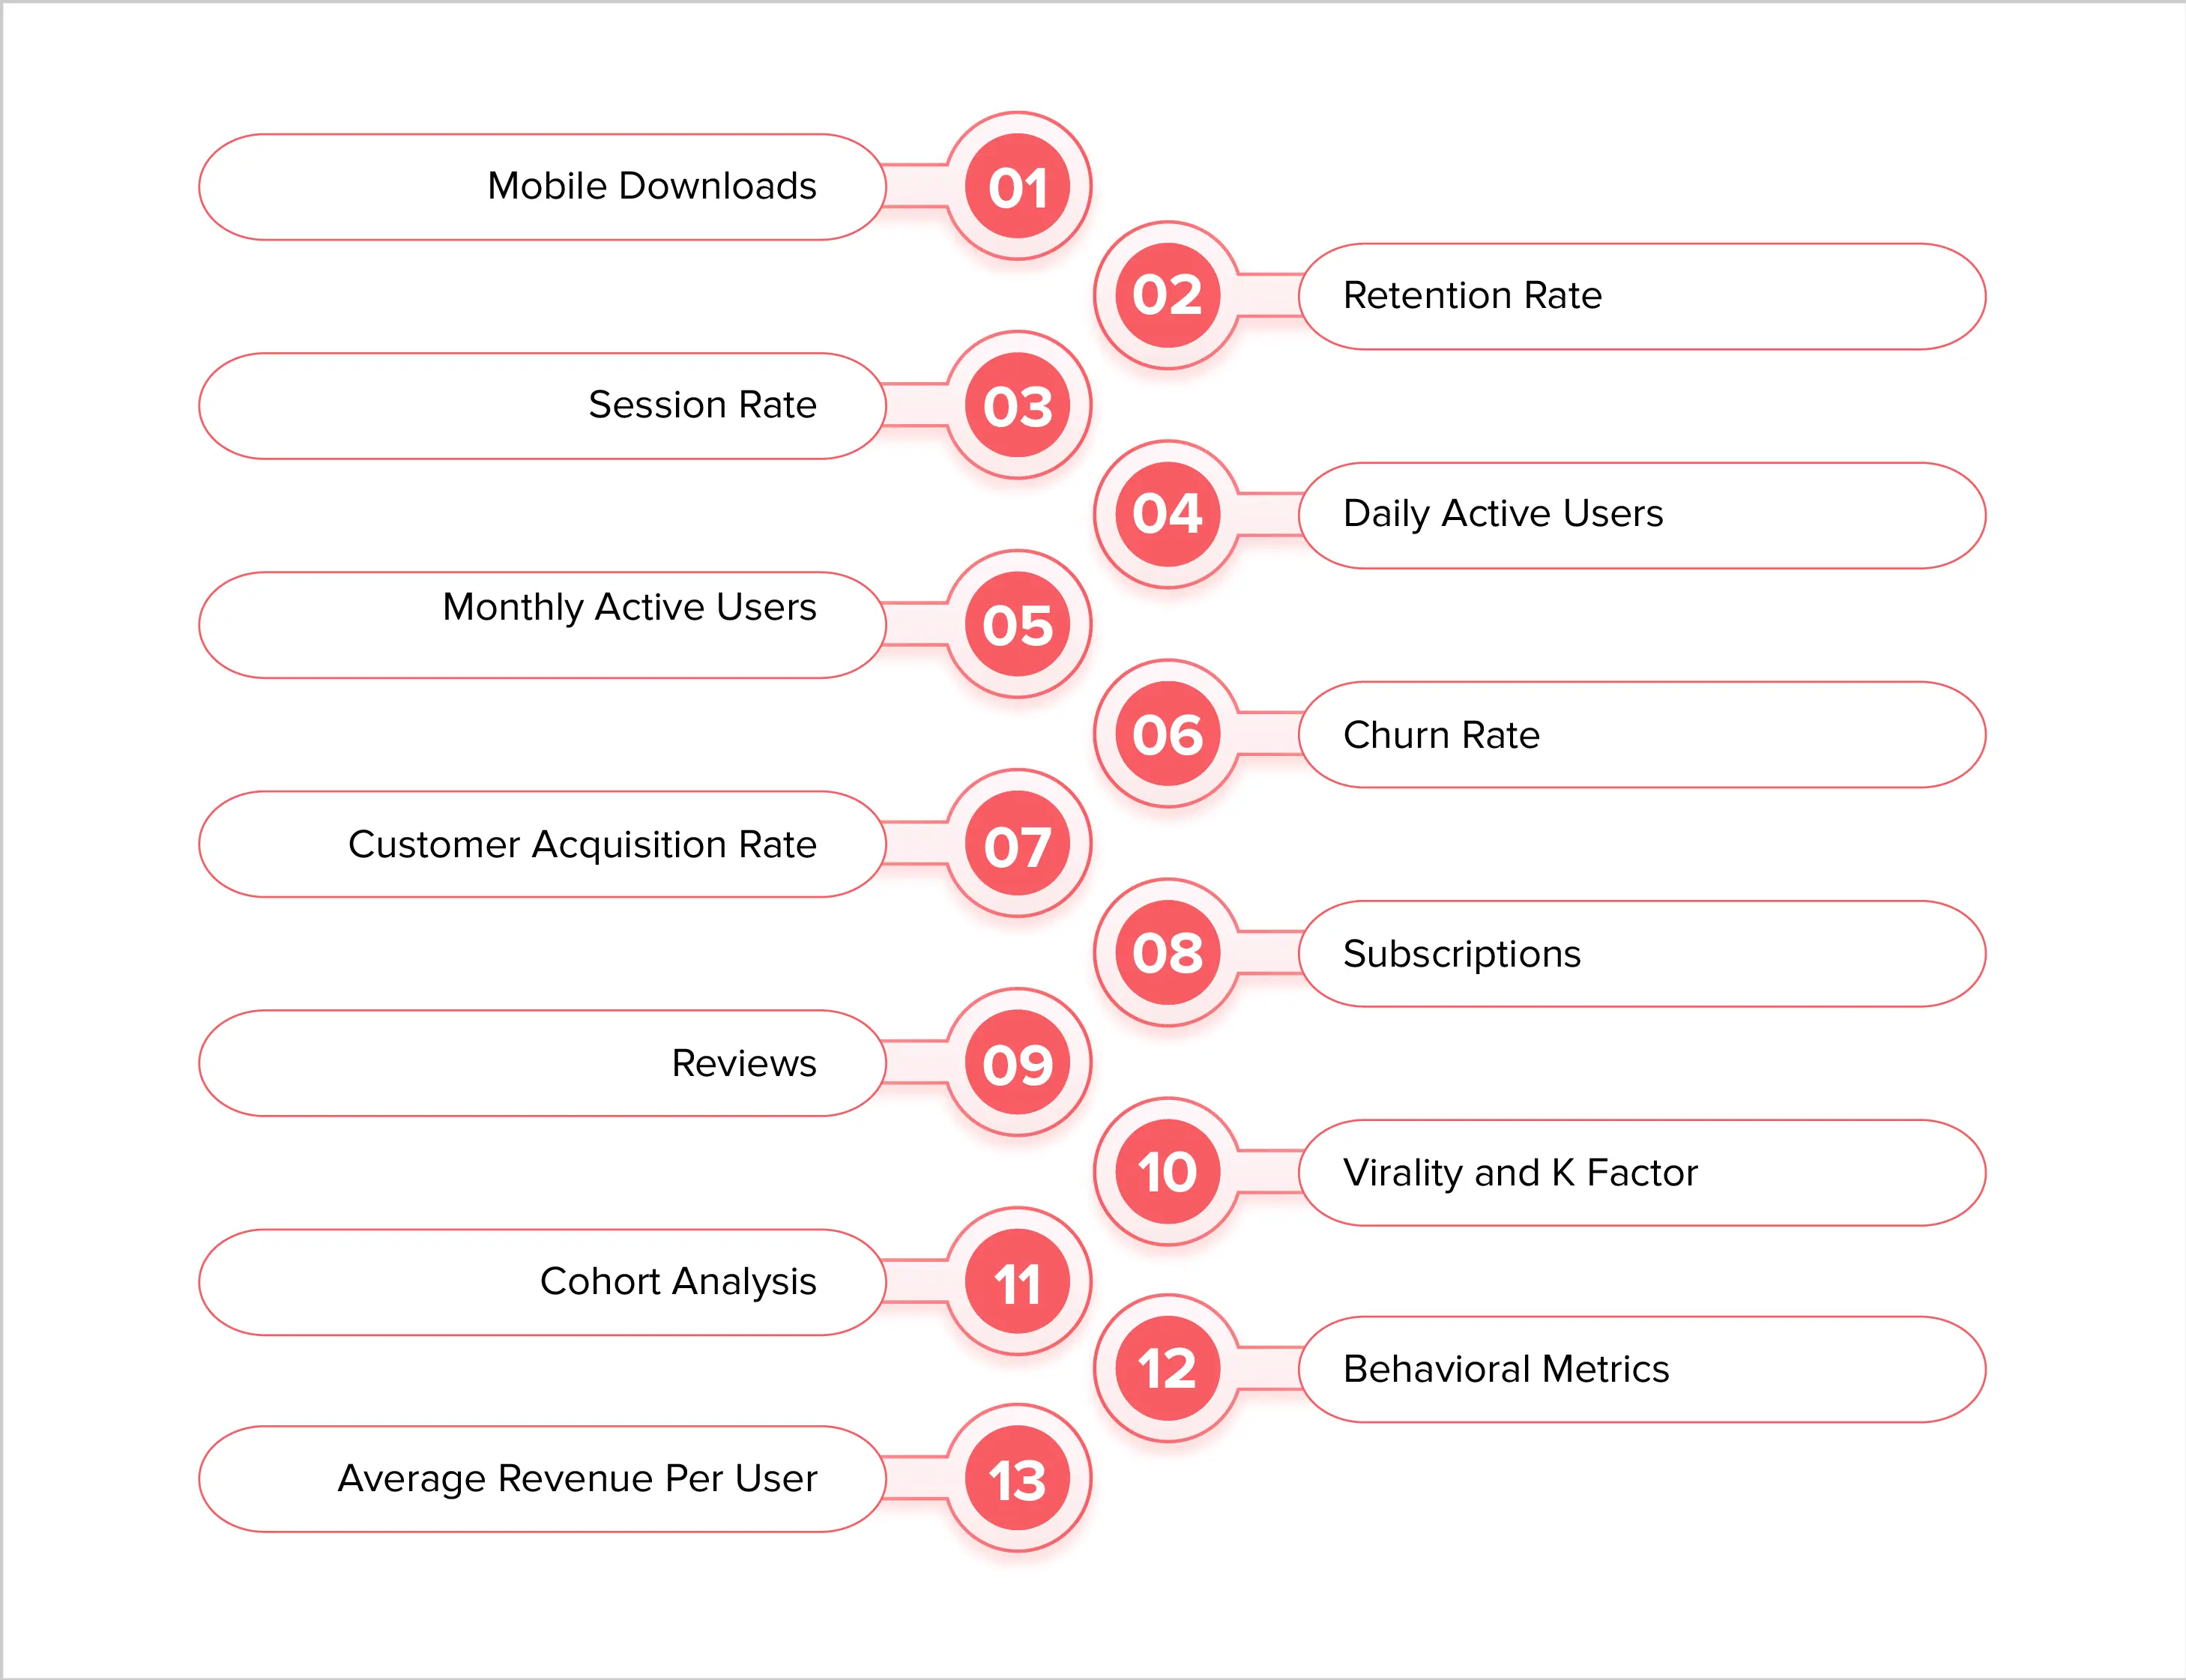
As of now, there are so many metrics available that can describe the success of your application. However, below we have mentioned some of the most important yet simple metrics, one can go through and get an idea about their app’s performance.
Therefore, let’s check them out one by one:
1. Mobile Downloads
Achieving the number of mobile downloads that can generate enough revenue to run operations without losing money, is the first essential goal. Adding to it, the second thought is to make the application profitable. The number of downloads of an application is one of the most basic litmus tests that one can conduct. To know the number of downloads, one can visit the app page on the app stores i.e. PlayStore and App Store. Additionally, they can also use an app analytics tool to get this number.
2. Retention Rate
Ideally, everyone wants to create an application that sticks. A mobile app that is liked by its users.
Retention rate is a metric that gives a reality check in that accord. The retention rate checks the number of users that have returned to your app in a specified time period. It is amongst the most essential mobile app metrics, considering, the higher the retention rate, the better the chances of an app to become successful and mainstream.
Here is the formula to calculate the retention rate of an application accurately:
Retention Rate = ((CE-CN)/CS)) * 100
Where,
CE = Total number of customer visits at the end of a cycle (a time period)
CN = Number of new customers that are using the application in a cycle
CS = Total number of customers at the start of the cycle
3. Session Rate
Session Rate is another useful metric for mobile apps to check an application's stickiness and measure marketing performance. A session rate is the number of times the user opens up your application. One thing that you need to be careful about is that each visit by the user is considered a session. However, the amount of time that a user spends on a page to be considered a session can be different and is open to interpretation as per the KPIs of the company behind the app.
In fact, sessions are segregated and shown individually for each channel. It means one might receive sessions for two different app stores differently i.e. Google Play and Apple App Store.
4. Daily Active Users
A basic mobile app metric to check the efficacy and stickiness of your application. It is the number of users who visit your application on a daily basis.
5. Monthly Active Users
This mobile app analytics metric is similar to the upper one. However, the primary difference is that monthly active users are the total number of users that visit your application in a month. However, it is important to know that the analytics tools consider each session as a unique visitor. Adding to this, the information displayed can be a single user visiting the application for multiple reasons again and again.
6. Churn Rate
The churn rate is the rate of the number of people who unsubscribe or uninstall the application. The churn rate of an application can be high due to multiple reasons. Some of the reasons are mentioned below:
- The app is not providing any value to the user anymore
- He/she was not the ideal customer
- There hasn’t been abundant new content
- Loads of bugs and crashes on the app
- Multiple in-app advertisement that spoils the experience
Following effective performance testing practices for mobile apps can also help businesses reduce crashes, improve responsiveness, and enhance the overall user experience.
7. Customer Acquisition Cost
Companies spend a lot of money on marketing operations. Some of these companies even go out to hire celebrities who are expensive beyond measure and spend money on different discounts, offers, and marketing campaigns. Therefore, there is a cost associated with hiring a new customer i.e. the customer acquisition cost. It is the amount of money spent on acquiring new customers in a given period of time.
This can be calculated by dividing the revenue generated by the application by the marketing cost.
8. Subscriptions
It is another way of determining the success of an application. The higher the number of subscribers for an application, the higher its revenue. It is another easy indicator to understand whether the application is liked by its customers or not.
In fact, one can see the rate of new subscriptions and it would give insights related to the rise and fall of subscriptions in different timelines.
9. Reviews
Checking the reviews is an absolute necessity. Not only do these app reviews help you understand the USP of the application as per its users but they also help you understand the truth about the app’s capability.
See, not everyone leaves an honest review, however, there are people who genuinely critique your application and tell you where it needs to improve. This is a goldmine, if one truly wishes to make their application successful. As an app entrepreneur, one only needs to listen to these customer reviews and do everything possible to make the changes, especially if they seem relevant.
10. Virality and K Factor
Virality in essence is the popularity of the application and the word of mouth associated with the application. In order to understand the virality of an application, one needs the K Factor. K factor is the number of mentions an application has received that has led to possible conversions. The higher the K factor, the better the app’s virality.
11. Cohort Analysis
An application can cater to different segments of users. For instance, an application can be used by both Boomers as well as Gen Zs. Therefore, it is important to segment users in the mobile app metrics and see the changes that happen in each segment. This will help you understand the trend associated with it.
12. Behavioral Metrics
It is the unique behavior that is displayed by the users on your application. This will help you take a peek inside their head. It will help you understand your user’s preferences for different attributes of your app service. For instance, if in a month a certain user segment shows more interest in the horror genre on Netflix then Netflix should focus on aggregating and creating more horror content for that segment.
13. Average Revenue Per User
Marketing or spreading awareness for your application is multi-faceted in terms of cost. There are multiple spaces or operations for which a company has to spend capital on video content, social media, paid ads, influencer marketing, etc.
In order to run these operations, the acquired cost is a lot. Therefore, it is important for companies to see the amount of revenue brought by a single user. This is considered average revenue per user.
App Analytics Tools to Start Your Data-Driven Marketing Journey!
There are multiple app analytics tools available in the market, each with its own set of unique features (in some way or the other). Some of the most popular app analytics tools used by the best mobile app marketing companies are:
1. Mixpanel

Mixpanel is a mobile and web analytics tool capable of providing mobile app analytics metrics. It is able to provide concise reports of the different interactions the customers have with an app. With Mixpanel, the user gets the capability to create custom reports and the capability to measure customer retention and engagement.
Here are some features of Mixpanel:
- It is free for up to 100,000 user tracking
- It lets you monitor multiple metrics such as engagement rate, retention rate, conversion rate, marketing funnel, etc.
- It offers product analytics via account-level analytics, user-level analytics, segmentation, and funnel
- It is capable of providing real-time reporting, segmented reporting, and custom reporting
- It has a dedicated dashboard
2. Amplitude

Amplitude has the power to unlock the potential of a product by measuring marketing performance. It gives its users access to an entire ecosystem of insights (related to historical sales and marketing) which connects applications, servers, tools, and data warehouses. It is an incredible tool that is being used by companies such as Paypal, HBO, Doordash, etc.
Here are some features of Amplitude that make it a suitable tool for measuring marketing performance:
- It can be easily connected with the user’s app via the API
- It can help in behavioral targeting
- It provides recommendations for its users
- It has the capability to monitor in-app event tracking
- It can help with revenue tracking
3. AppsFlyer

AppsFlyer is another compelling application that can provide metrics for mobile apps, for marketers. It has the capability to reinforce data-driven decision-making. It gives the necessary visibility to its users with campaign performance and the capability to get more user installations and subscriptions.
Here are the features of AppsFlyer, a mobile app metrics tool:
- Get additional filters and KPIs
- Drag-n-drop interface for ease of use
- Monitor app performance 24*7
- Get real-time downloadable reports with email notifications
- Audience segmentation tools
App Analytics - Future Trends!
App Analytics is constantly evolving with new ways of monitoring app performance. Below, we have mentioned some of the app analytics future trends that are present and will prevail in the future. These are:
1. Artificial Intelligence and Machine Learning

Artificial intelligence and machine learning are proven technologies. They provide the capability to predict insights automatically by analyzing the data. Also, the more data the AI models go through, the better and more accurate it becomes. These technologies are capable of providing insights into customer behavior, identifying patterns, automating complex tasks, and a lot more. Adding to it, once deployed, AI systems don’t even require coding to operate.
AI and ML are two technologies that have already made their way to app analytics. In the future, it is highly likely that the technologies will be catering to plenty of use cases.
2. Data Visualization
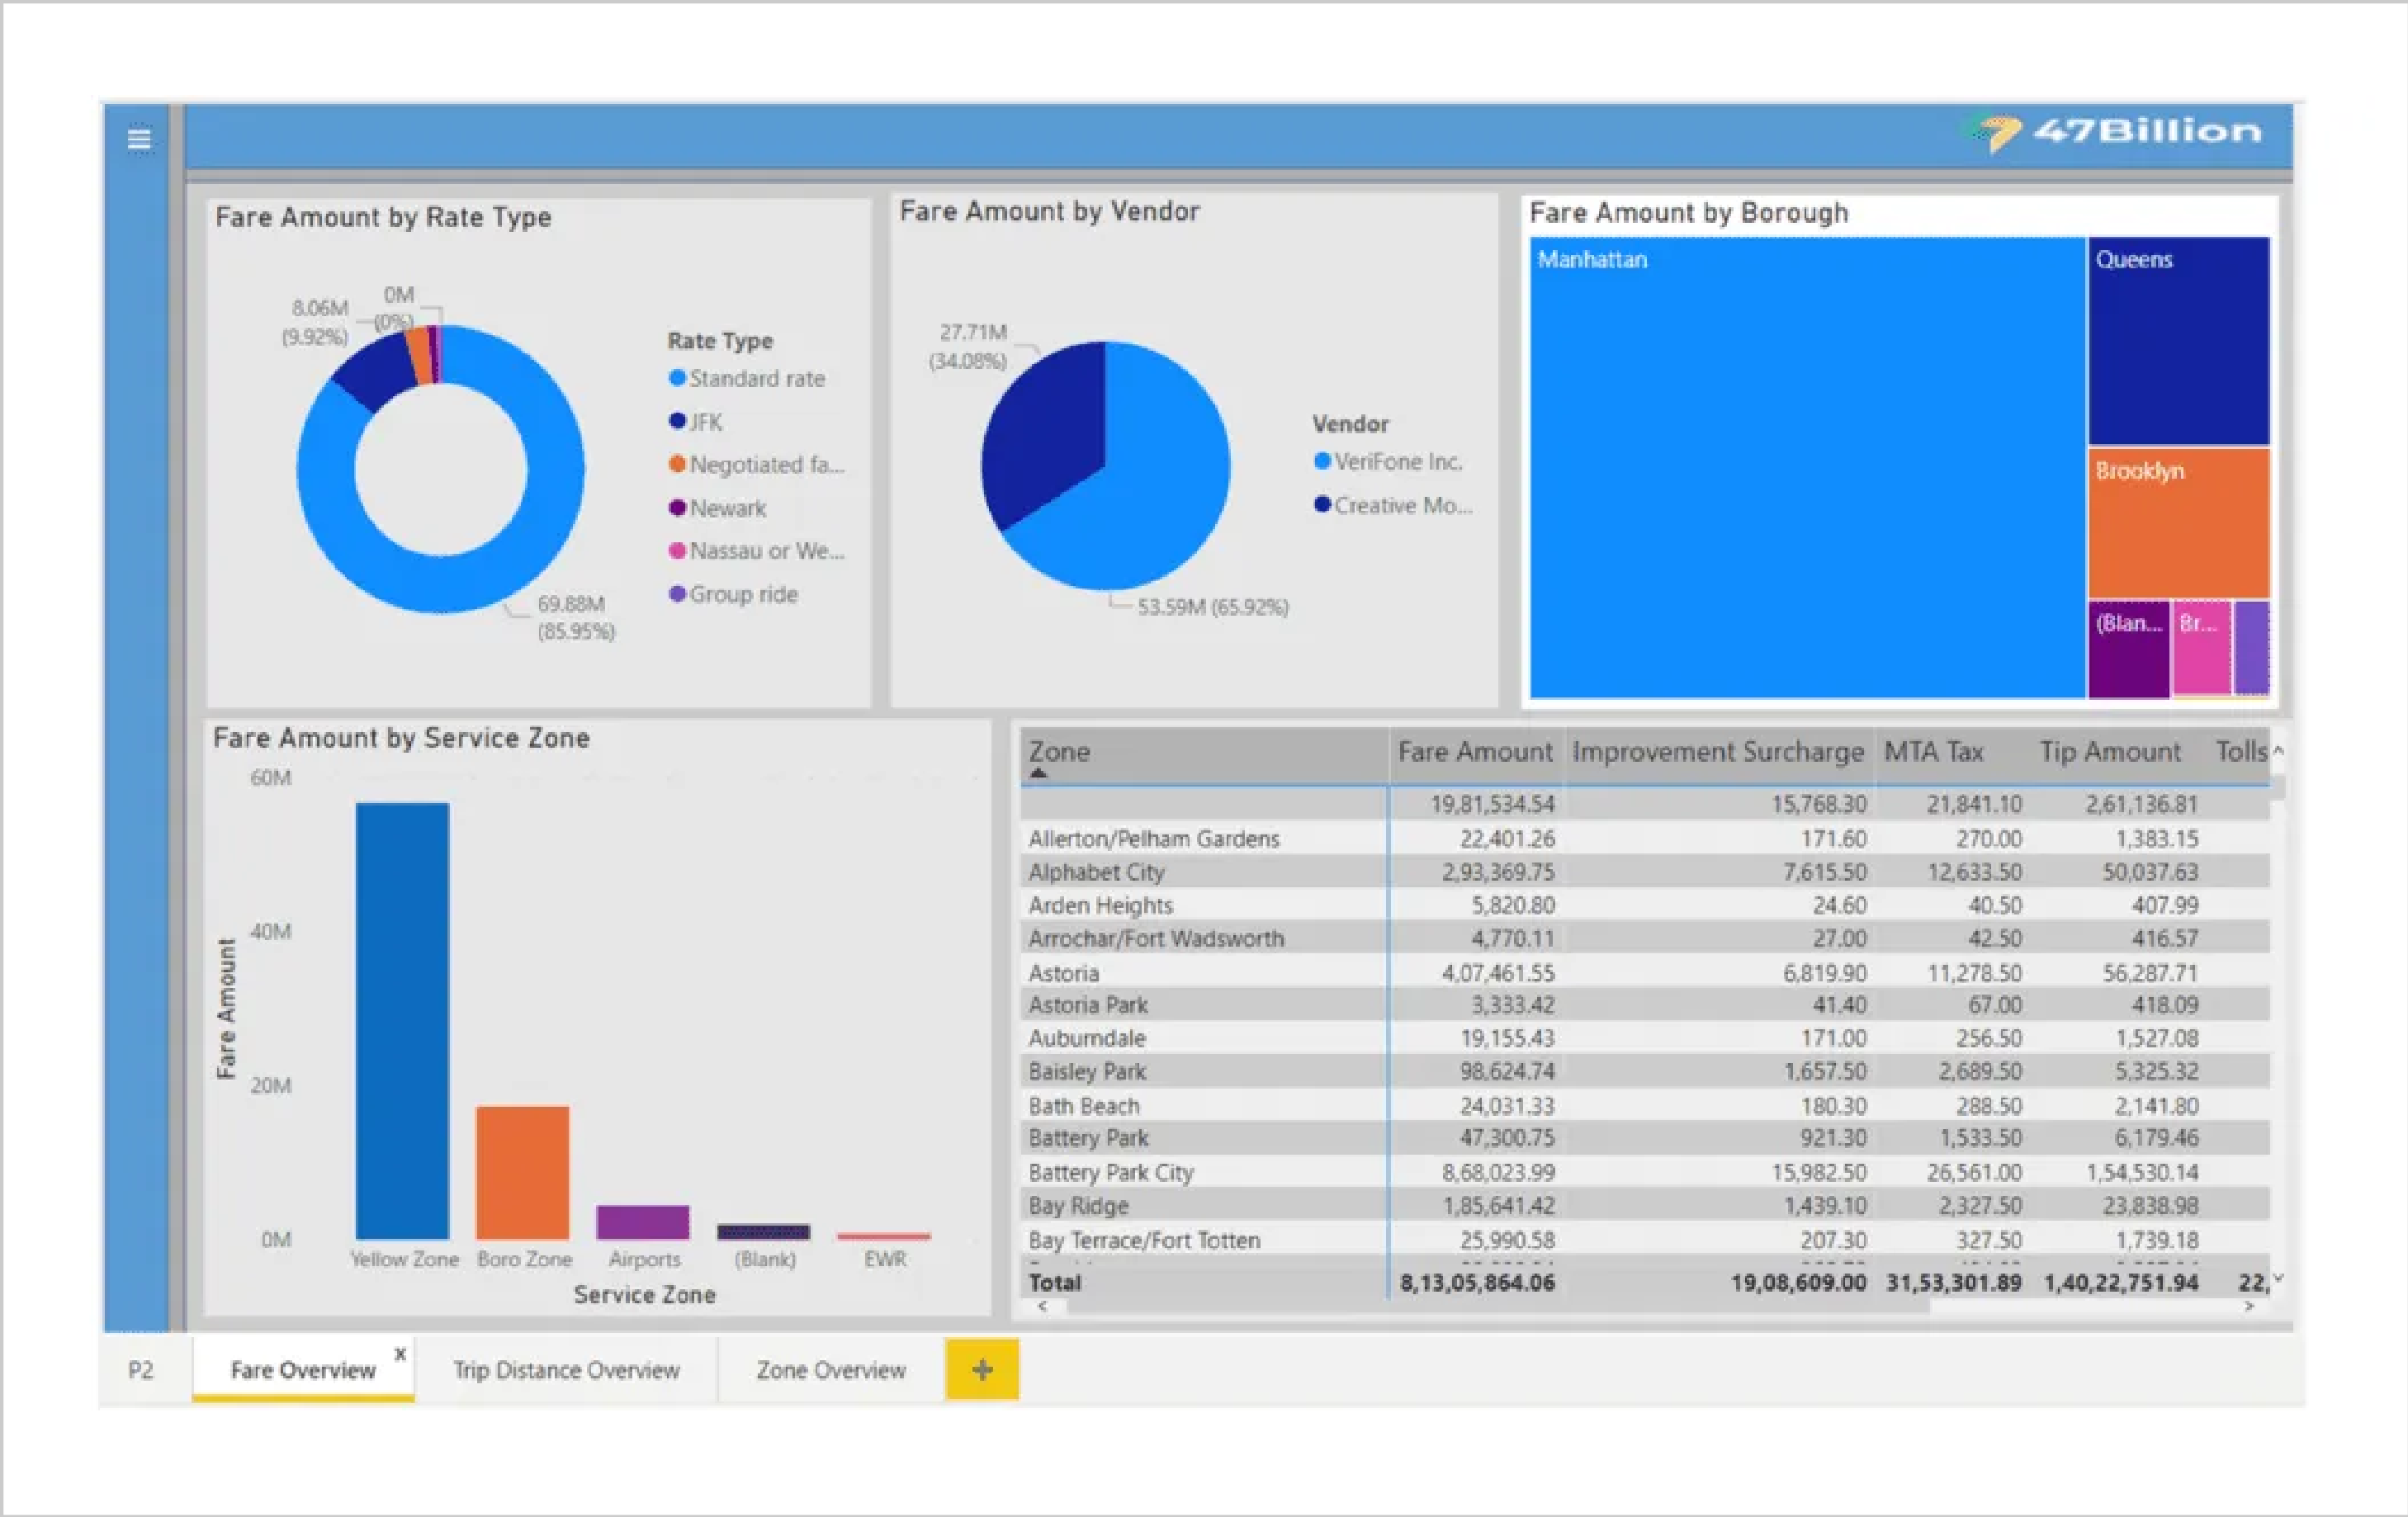
A company generates tons of data in a single cycle (timeframe). Therefore, it is almost impossible for CXOs, managers, and other decision-makers to go through the raw data generated.
Data visualization has been here for a while. However, previously the entire work related to representing data in a visualized format was done manually. Although, today, we have data visualization tools such as Tableau, Microsoft Power BI, Looker, etc. These tools can consolidate data from different operations including marketing, and visualize them in charts, graphs, diagrams, etc. It makes the process of consuming this data easy and helps in effective decision-making.
3. Natural Language Processing
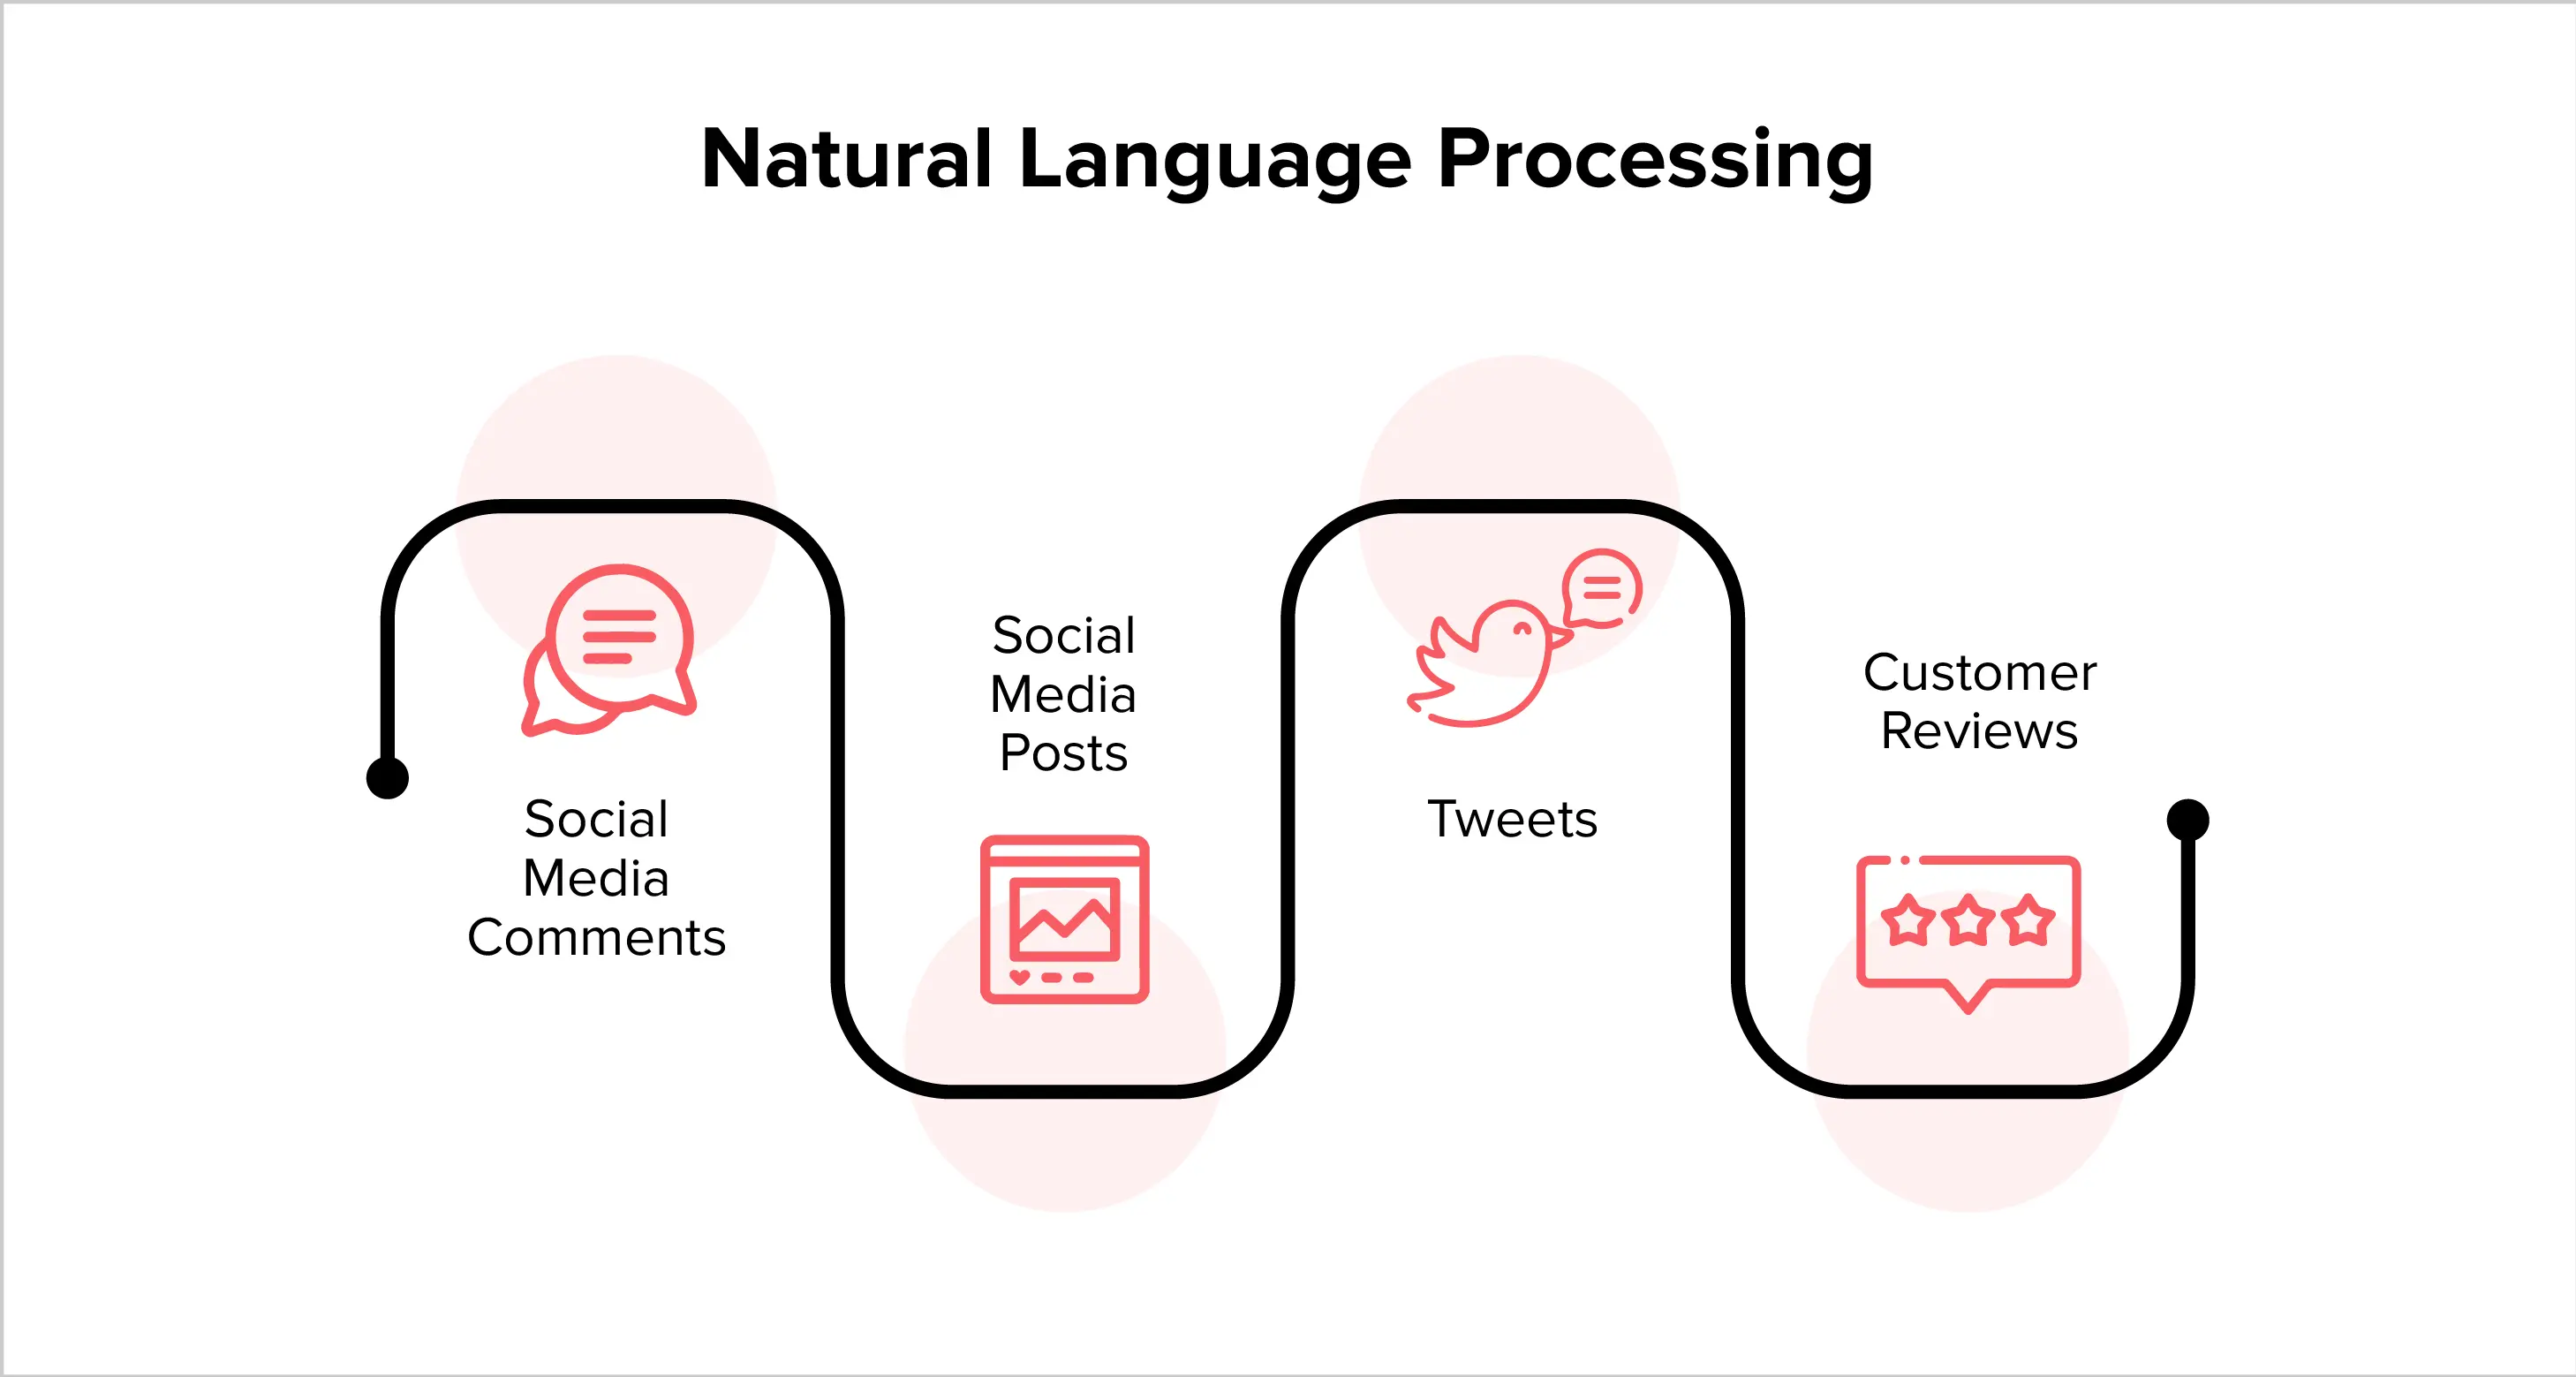
Natural language processing is an important technology in today’s day and age. It gives the capability to a computer to understand human language and make sense of it by analyzing the content and understanding the context.
This technology is widely used for analyzing unstructured data on the internet for social media, posts, customer reviews, mentions, etc. This helps in text classification, sentiment analysis, and even language translation.
4. Augmented Analytics

Augmented analytics is the combination of AI, ML, and NLP. It helps in creating a data-driven ecosystem that is capable of providing automated insights. It helps in preparing data, gathering insights, and data visualization, etc. The technology is empirical in democratizing data and creating a data-driven environment.
5. Data Privacy

With the widespread use of the Internet and day-to-day life becoming more reliant on its power, there are a series of places where apps collect sensitive data from their customers. In this situation, it is important to focus on data privacy and implement ethical AI as the apps need to comply with different regulations established by governing bodies.
There are regulations such as the Privacy Act of 1974 (U.S.A), GDPR (General Data Protection Regulation), HIPAA (Health Insurance Portability and Accountability Act), etc. that demand app owners to protect customer data. With AI becoming omnipresent, it is essential to have ethical AI that ensures fairness towards the usage of customer’s data and makes sure that companies are not crossing barriers.
Wrapping Up!
Today in order to survive, one needs to understand the requirements of its customers. They need to carefully create their application such that it has a maximum penetration rate amongst its audience. The best way to achieve it is via app analytics. App analytics detailed metrics tell you about the overall performance and health of your app in the market. Adding to it, these metrics also become a gateway to make changes that will provide more productivity to the user. Therefore, if you truly wish to be a part of that A-list, the first thing that needs to be done is to hear customers via app analytics.
Frequently Asked Questions
What are some marketing performance metrics?
Here are some marketing performance metrics:
- Reach
- Engagement
- Conversion Rate
- Cost Per Lead
- Cost Per Acquisition
- Return on Investment
What are some mobile analytics solutions or mobile app analytics services?
Some of the best mobile analytics solutions or mobile app analytics services are:
- Adobe Analytics
- Flurry
- AppsFlyer
What are some performance marketing strategies?
Some of the performance marketing strategies are:
- PPC
- Search engine marketing
- Social media marketing
- Affiliate marketing
- Content marketing
- Dynamic marketing
What are some ways of mobile app analytics integration?
There are several ways of mobile app analytics integration such as:
- Integrating app analytics via SDKs
- Using a cloud-based analytics platform
- Working with a custom analytics solution
What is Android analytics?
The app analytics that is specific to the Android platform is considered Android Analytics
What is performance marketing?
Performance marketing is a pay-per-performance model strategy. It uses digital marketing strategies to drive website traffic, leads, or sales. The payment is made to the advertiser only when a certain action is taken for instance clicks, leads, or sales.

Uncover executable insights, extensive research, and expert opinions in one place.
Related Content